![Best financial modeling software [2026 review]](https://www.cubesoftware.com/hubfs/Cube%20website%20-%202026/Blog%20Post%20-%20Featured%20Images/Featured%20-%20Sheet%20Pie%20Chart.png)
Key takeaways:
- Financial modeling software unifies actuals, budgets, and forecasts in one environment, giving finance teams a clear, consistent view of business performance.
- Strong platforms integrate with ERP, CRM, HR, and billing systems so models stay synchronized with live operational data instead of static exports.
- Advanced tools support multi-scenario and multi-currency planning, making it easier to compare best case, base case, and downside cases across entities and regions.
- Fit depends on company size, data complexity, and planning maturity, so teams should match solutions to their needs, from spreadsheet-native FP&A tools to fully connected enterprise planning platforms.
Best financial modeling tools at a glance
Before we dive into the details, here’s a sneak peek at some of the best financial modeling tools available today:
- Cube: A spreadsheet-native financial intelligence platform that connects to Excel and Google Sheets for driver-based modeling, scenario planning, and FP&A.
- Oracle BI: A business intelligence suite for building dashboards, analysis, and reporting across large datasets and enterprise systems.
- Jirav: A planning and reporting tool that connects financial and operational data for forecasting, budgeting, and scenario modeling.
- Finmark: A startup-friendly finance planning tool built for forecasts, runway planning, and scenario analysis with simple inputs.
- Quantrix: A multi-dimensional modeling platform designed for complex models, what-if analysis, and structured planning.
- Synario: A scenario modeling and strategic planning platform built to test assumptions and compare outcomes across multiple futures.
- IBM Cognos: An enterprise analytics and reporting platform that supports dashboards, forecasting, and standardized financial reporting.
- Sage Intacct: A cloud accounting platform with strong financial reporting and integrations, often used as a source system for modeling and planning.
- Jedox: An FP&A platform for budgeting, planning, and forecasting that supports templates, automation, and reporting workflows.
- Anaplan: An enterprise planning platform known for connected modeling across finance, sales, supply chain, and workforce planning.
- Datarails: An Excel-based FP&A platform that automates consolidation, reporting, and planning while keeping familiar spreadsheet workflows.
- Planful: A financial performance platform for planning, reporting, consolidation, and close, with AI-assisted analysis features.
- Causal: A modern modeling tool that uses human-readable formulas, live data connections, and scenario planning with shareable dashboards.
- Budgyt: A budgeting and forecasting platform built to replace fragile Excel rollups, with drill-down reporting and controlled collaboration.
What is financial modeling software?
Financial modeling software uses automation and artificial intelligence (AI) to build structured, repeatable financial forecasts. It connects to systems such as your ERP, accounting platform, CRM, HRIS, and spreadsheets, then organizes and analyzes that data so finance teams can model revenue, margins, cash flow, and other drivers across different business scenarios.
A key benefit is error reduction. Research found that 94% of business spreadsheets used in decision-making contain errors, which creates real risk when models sit entirely in manual files. At the same time, FP&A surveys show that teams still spend close to half their time on data collection.
Key features of financial modeling tools
Financial modeling tools offer several key features that enhance their functionality and utility. These often include:
AI-powered modeling
Traditionally, finance teams relied on basic financial modeling formulas—often limited by the tools and data available—to estimate the potential impact of business decisions. These models were built on static assumptions and required significant manual effort to update and adapt as new information became available.
With AI-powered FP&A software, finance teams can now build dynamic, data-driven models that adapt in real-time to changing conditions. AI finance tools can analyze vast datasets, uncover hidden patterns, and generate predictive insights that go far beyond what traditional formulas could achieve.
Custom, multi-scenario modeling
Users can create customized models tailored to specific business needs, providing a higher level of flexibility and precision. Many financial modeling tools support multi-scenario analysis, allowing businesses to evaluate multiple outcomes based on different assumptions and variables, making it easier to plan for different future possibilities.
These tools can also accommodate a wide range of scenarios, helping companies prepare for the best-case, worst-case, and most likely scenarios, enhancing strategic planning and risk management.
Trusted data access and validation
Ensuring data accuracy is crucial in financial modeling since erroneous data can lead to flawed analyses and poor decision-making. Manually checking data can be a time-consuming process that pulls valuable resources away from more strategic tasks.
Advanced financial modeling tools provide robust mechanisms for validating data inputs to ensure consistency across all data points used in the models. Maintaining data integrity throughout the modeling process allows users to trust the results and make informed decisions based on reliable information.
Automated audit trails
Financial modeling tools include features for creating automated audit trails, which are essential for maintaining a transparent and accountable financial modeling process. This capability tracks all changes made to financial models, documenting who made the changes and when they were made, thus providing a clear history of modifications.
Automated audit trails enhance transparency, facilitate compliance with auditing standards and regulatory requirements, and make it easier to identify and rectify any errors or inconsistencies.
Source system integrations
Integrating with source systems such as accounting software, CRM platforms, and ERP systems is a key capability of most financial modeling tools, ensuring that data flows seamlessly into the financial models. This integration allows for the real-time import of accurate data, keeping financial models up-to-date and reflective of the latest business conditions.
These tools pull data directly from trusted source systems, reducing manual data entry, minimizing errors, and enhancing the overall efficiency and reliability of the financial modeling process.
Multi-currency support
Businesses often operate in multiple currencies, requiring financial models that can handle various monetary units.
Financial modeling tools with multi-currency support enable users to perform financial analysis and report in different currencies. These tools allow businesses to convert and consolidate financial data across currencies seamlessly, ensuring that financial reports and analyses are consistent and compliant with global standards.
Collaboration features
Most financial modeling tools make it easy for finance teams to share insights with stakeholders and decision-makers. Data sharing, change tracking, and customizable access permissions help multiple users collaborate on models in real time.
Teams can quickly distribute reports, gather meaningful feedback, and ensure everyone makes decisions based on the most up-to-date financial data.
Data visualization and reporting
Financial modeling tools typically include automated financial reporting that can transform raw numbers into easy-to-understand visuals like charts, graphs, and dashboards. This allows finance teams and stakeholders to grasp key insights, trends, and patterns at a glance instead of trying to decode rows of data.
You can even customize the looks of reports to highlight your most important metrics, compare key scenarios, and present summaries in digestible ways.
Map consolidation
Map consolidation helps finance teams bring data together when it comes in different formats, structures, or levels of detail. Instead of manually adjusting charts of accounts, department names, or account groupings every time new data arrives, the software applies a consistent mapping layer.
This lets you roll up actuals, budgets, and forecasts across multiple locations, departments, or entities without rebuilding the model each time. It also keeps everything aligned to one reporting structure, which makes consolidated reporting faster and reduces errors.
Scenario modeling
Scenario modeling lets finance teams test assumptions and see how changes in key drivers affect revenue, margins, cash, and runway. With modern financial modeling tools, you can adjust inputs like hiring plans, pricing, churn, or expansion timing and instantly compare best-case, base-case, and downside scenarios.
Many platforms now combine driver-based models with AI-assisted forecasting so you can build scenarios faster and update them more frequently. This gives leadership a clearer view of risks and opportunities, supports better decisions on investments and cost controls, and makes it easier to answer “what happens if…” questions during planning cycles or board reviews.
Best financial modeling software
Accurate and accessible financial models are invaluable to every organization. To help you choose the best option for your team, we put together this list by reviewing vendor websites and product documentation, comparing third-party review site feedback, and weighing core criteria like integrations, scenario modeling depth, collaboration controls, and implementation effort.
1. Cube
![]()
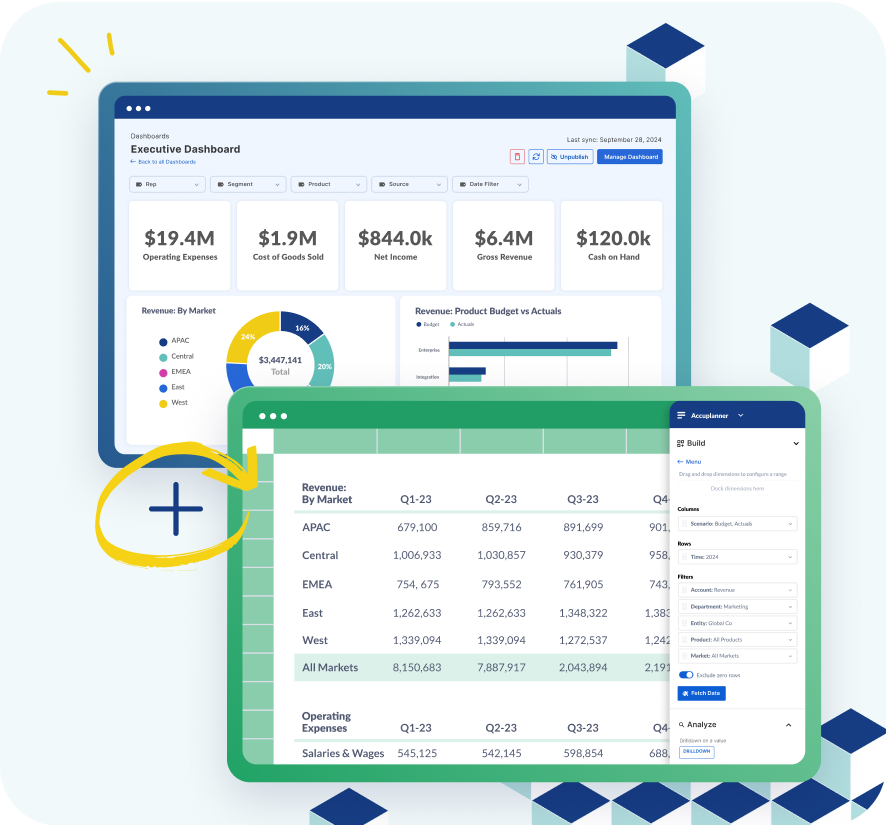
Cube is an AI-powered financial intelligence platform that supercharges FP&A teams wherever they do their best work, including spreadsheets, browsers, and collaboration tools. By integrating natively with both Excel and Google Sheets, Cube enables finance teams to plan, analyze, and collaborate with a single source of trusted financial intelligence.
From multi-entity retailers to mission-driven nonprofits, modern FP&A and finance leaders use Cube’s no-code FP&A platform to achieve and sustain strategic finance. Cube simplifies cash flow modeling by allowing teams to create and manage both direct and indirect cash flow, automatically compiling data from sales, expenses, investments, and financing activities. The result is more accurate cash flow statements and deeper insight into financial performance and quality of earnings.
Cube also makes financial modeling faster and more reliable by letting teams work the way they already do, while eliminating manual overhead. With Cube, you can:
- Build models in Excel or Google Sheets exactly the way you normally would
- Connect models to live data, so you’re no longer copying and pasting exports each week
- Run scenarios and forecasts without duplicating files or breaking formulas
- Share a single, governed model with the business in Cube Workspace, where budget owners can review, comment, and submit inputs without touching the underlying formulas
- Track changes, assumptions, and version history automatically, creating a clear audit trail
- Standardize metrics and definitions across teams to ensure everyone is working from the same numbers
To round it out, Cube delivers agentic AI designed specifically for finance. It understands the context of your models, pulls from structured financial and operational data, and provides clear, explainable answers instead of black-box outputs. Finance teams can ask questions in Slack, Microsoft Teams, or directly within Cube, receive variance explanations and narrative commentary, and refine assumptions in real time, all while staying fully in control of the story behind the numbers.
Key features:
- Intelligent mapping: Converts plain language mapping rules into structured dimensions and hierarchies so changes cascade across entities, accounts, and models without error-prone rework.
- Spreadsheet native modeling: Keeps bi-directional sync with Excel and Google Sheets so FP&A can plan, report, and model in familiar files while data stays centralized.
- Automated data consolidation: Connect data from numerous sources for automated rollups and drill-downs.
- Multi-scenario analysis: Seamlessly model how changes to key assumptions affect overall outputs.
- Smart forecasting: Access AI-generated forecasts help teams identify trends, predict outcomes, and uncover risks before they impact performance.
- Conversational insights: Ask Cube’s AI Analyst questions directly in Slack, Microsoft Teams, or your Cube Workspace—and get instant, explainable answers.
- Drill-down and audit trail: Access the transactions and history behind a single data cell with just one click.
Pros:
- Enables teams to build and adjust driver-based models and run scenarios without duplicating spreadsheets or breaking logic
- Lets department leaders submit forecast and headcount inputs and explore variance drivers in one shared model, improving version control
- Offers seamless integrations with spreadsheets (Google Sheets and Excel), accounting and finance, HR, ATS, billing and operations, sales and marketing, and business intelligence tools
- Saves time by automating menial tasks
Cons:
-
Cube doesn't sell to companies outside of the US and Canada at this time.
Pricing: Cube's pricing starts at $30,000 annually

2. Oracle BI
![]()
Oracle BI pairs with other Oracle products to deliver visual analytics and calculations for sales, HR, supply chain, finance, and other functions. It sits inside Oracle’s broader Business Intelligence portfolio, which includes a BI server, dashboards, ad hoc querying, reporting, and data integration in a single, web-based environment.
The centralized BI server lets teams standardize calculations and metrics across departments and apply a consistent data model across reports and dashboards. Oracle BI works for organizations already committed to Oracle databases or Oracle Cloud applications and looking to extend that stack for analytics and performance management. The scope and architecture add complexity, so projects often involve IT ownership, longer rollout cycles, and dedicated training before FP&A and business users feel fully comfortable in the platform. For financial modeling, teams can use governed datasets and standardized metrics to build scenario and variance views that support forecasts and performance analysis.

Key features:
- Provides secure data warehousing to users.
- Includes an at-a-glance dashboard.
- Allows ad-hoc reporting with predictive and profit analysis.
- Allows what-if analysis using parameters.
- Supports scenario modeling for long-range forecasts.
Pros:
- Facilitates visual report building with a single dataset and delivery to multiple sources.
- Utilizes existing PL/SQL code.
- Allows the saving of reports for recurring use.
Cons:
- Poses a steep learning curve, especially for businesses not currently uising Oracle products.
- Presents visually unappealing reports, especially compared to other BI products.
- Lacks adequate tech support.
Pricing: Pricing isn't available on its website
3. Jirav
![]()
Jirav is a reporting and planning platform built for budgeting, forecasting, and scenario planning, with dashboarding and custom reporting included. It combines data from financial systems and other business tools, then lets FP&A teams compare plan vs. actuals across multiple scenarios and time horizons.
The platform supports driver-based budgeting and rolling forecasts, so teams can update assumptions tied to revenue, costs, cash flow, and working capital and see how changes affect the plan. For financial modeling, Jirav lets teams structure models around key drivers, adjust assumptions, and compare scenario outputs without rebuilding the model each cycle. Jirav also positions itself for two main audiences: accounting and CFO advisory firms that support multiple clients, and small to mid-sized businesses that need a structured planning process tied to ongoing reporting.
In practice, Jirav is used for annual operating plans, mid-year reforecasting, and scenario analysis, with collaboration features aimed at keeping department owners aligned on targets and performance tracking.
-png.png?width=712&height=450&name=jirav-Dashboard%20(1)-png.png)
Key features:
- Offers financial forecasting and cash flow projections.
- Provides workforce planning with data modeling.
- Includes executive summary reports with custom KPIs.
- Integrates payroll, accounting, and general ledger functionalities.
Pros:
- Offers pre-built formulas and templates.
- Facilitates roll forward forecasts and data without spreadsheets.
- Provides customizable dashboards for financial and non-financial data.
Cons:
- Features a steeper learning curve.
- Provides limited variety in visualizations.
- Works best for smaller businesses that can afford a higher price point.
Pricing:
- Controller essentials: Starts at $50/month
- CFO enterprisey: Starts at $150/month

4. Finmark
![]()
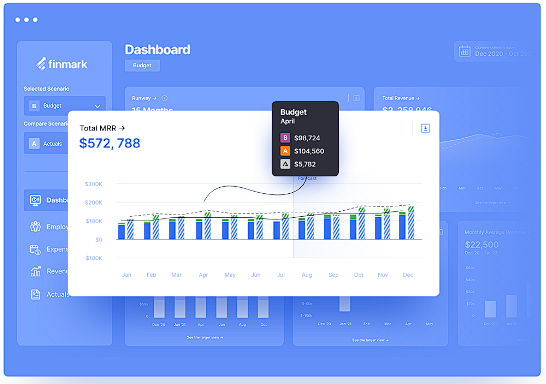
Finmark is a financial planning and modeling platform designed for founders, small businesses, and mid-sized finance teams that need structured budgeting, forecasting, and scenario planning without building everything from scratch. It connects directly to accounting, payroll, billing, and payment systems, then brings that data into a centralized planning environment where teams can track runway, burn, revenue, expenses, and headcount in real time.
The platform is commonly used for budget vs. actuals analysis, rolling forecasts, hiring plans, and fundraising preparation. Finmark emphasizes guided financial modeling, helping teams build plans around drivers such as revenue growth, payroll changes, and operating costs while maintaining a single source of truth for reporting. It is also positioned for collaboration, allowing finance teams, founders, and external advisors to review plans, compare scenarios, and share controlled views of financial performance without managing multiple versions of spreadsheets.
Key features:
- Allows model customization with multiple scenarios.
- Facilitates team collaboration on financials.
- Provides visualization options for specific metrics.
- Supports planning for fundraising and budgeting.
Pros:
- Improves financial planning and forecasts.
- Allows searching across numerous data points.
- Features an intuitive and easy to use interface.
Cons:
- Offers limited integrations.
- Presents a higher learning curve and limited help center.
- Focuses primarily on SaaS companies.
Pricing: Finmark starts at $50/month and rises based on a company’s annual revenue. Once a company’s annual revenue exceeds $3M, pricing is by quote only.
5. Quantrix
![]()
Quantrix is a multi-dimensional business and financial modeling platform built for organizations that want to model and analyze large, structured datasets outside of traditional spreadsheets. The product line includes Quantrix Modeler (desktop modeling), Quantrix Qloud (cloud sharing and collaboration), and Quantrix Enterprise (enterprise deployment), which lets teams separate model creation from model consumption, so stakeholders can access results without editing the underlying logic.
At the core of the platform is a multi-dimensional calculation engine designed for complex financial and operational models, including budgeting, forecasting, scenario planning, and data validation. Quantrix supports connecting to various data sources and maintaining model structure through version control, user roles, and permissions. The company also positions Quantrix for use cases that require linked models across many dimensions such as entity, product, region, time, and scenario, along with options to distribute outputs through shared models and reporting views.

Key features:
- Offers a timely alert system for potential errors or miscalculations.
- Provides a collaborative cloud modeling system.
- Facilitates the drafting of models from included templates.
- Integrates into other platforms for enhanced functionality.
Pros:
- Enables users to build forecasts and run what-if and multiple-scenario analyses.
Cons:
- Provides few visual depictions of data.
- Poses a steep learning curve for those unfamiliar with SQL.
Pricing: While pricing is not available on their website, sources report that the Quantrix Modeler desktop application costs $2,600/year. Quantrix Qloud pricing is by request only.
6. Synario
![]()
Synario is a financial modeling and strategic forecasting platform designed to support long-term planning alongside short-term budgeting. It is provided by PFM Solutions LLC and is commonly used by higher education institutions, public sector organizations, utilities, transit agencies, and enterprise organizations that require structured scenario and sensitivity analysis.
Synario is built around customizable financial models that support scenario planning, multiyear forecasting, and capital and operational planning within the same environment. Synario is often positioned for organizations that need to evaluate policy decisions, investment timing, rate structures, or sustainability initiatives across multiple future scenarios.

Key features:
- Manages multiple accounts with version control.
- Provides financial oversight with profitability analysis.
- Generates income and balance sheets with a general ledger.
- Offers asset lifecycle management capabilities.
Pros:
- Provides adaptable and scalable financial models.
- Offers cloud-based access for quick availability.
Cons:
- Software updates may alter the functionality of certain features.
- Poses a steep learning curve.
- Changing a model once it’s built can be difficult.
Pricing: An online sourceshares that Synario is available for $5,000/year.
7. IBM Cognos
IBM Cognos is a business intelligence and analytics platform used for reporting, dashboards, and data exploration across financial, operational, and business data. It is positioned as a governed BI solution, with certified data models, audit trails, and role-based access controls to support compliance and controlled reporting across organizations.
Cognos Analytics combines traditional reporting with interactive dashboards and AI-assisted analytics, allowing users to query data, explore trends, and generate reports from a centralized data environment.

Key features:
- Imports data from spreadsheets and CSV files.
- Connects to local or remote databases for reporting.
- Utilizes AI features for data preparation.
- Enables the creation of dynamic dashboards locally and remotely.
Pros:
- Accelerates data preparation with artificial intelligence.
- Collects both on-premise and cloud data.
- Utilizes interactive dashboards for visual presentations.
Cons:
- Focuses on adding new functionalities rather than improving the existing product.
- Reports may contain bugs and can be difficult to rectify.
- Restricts application integrations.
Pricing: Cloud subscriptions start at $10.60/user/month. For hosted or on-premise plans, you’ll have to contact them for a quote.
8. Sage Intacct
![]()
Sage Intacct is a cloud-based accounting and financial management platform used by growing and mid-sized organizations that need structured financial reporting, multi-entity accounting, and centralized financial controls. It serves as a system of record for general ledger, accounts payable and receivable, revenue recognition, and financial consolidation, with reporting and budgeting capabilities built on top of live accounting data. Teams also use Intacct’s live actuals and multi-entity structure as the baseline for forecasts, budget vs. actual analysis, and scenario updates in planning tools.

Key features:
- Imports essential financial information for seamless integration.
- Creates business plans and forecasts.
- Generates historical and forward-looking financial reports by pairing live actuals with financial models.
- Transforms data into insights with drag-and-drop charts and tiles.
Pros:
- Offers fast setup with native integrations.
- Facilitates sharing of plans and budgets without spreadsheets.
- Allows tailored dashboards for different audiences to drive quick decision-making.
- Integrates with Cube.
Cons:
- May be too complex for small businesses.
- Requires effort to integrate and set up initially.
- Features a higher learning curve.
Pricing: Sage Intacct offers custom pricing upon request.
9. Jedox

Jedox's financial modeling software offers a comprehensive tool for organizations aiming to enhance their financial planning and analysis capabilities. It provides pre-configured best practice models that can be easily tailored to specific requirements, facilitating collaboration across departments, data sources, and teams.
By consolidating data and processes organization-wide, Jedox ensures a unified source of information for all financial modeling needs, even amidst rapid changes.

Key features:
- Uses predefined models to start modeling quickly and reduce preparation time.
- Integrates with multiple data sources and systems.
- Supports dynamic scenario modeling, identifies patterns, anomalies, and operational bottlenecks.
- Facilitates cross-departmental collaboration with live updates and close model integration.
- Converts base currency amounts into reporting currencies, beneficial for international operations.
Pros:
- Enables rapid setup with pre-configured models for immediate use.
- Easily customizable to align with unique business requirements.
- Enhances modeling accuracy and decision-making with AI-driven insights.
- Facilitates efficient collaboration across departments with up-to-date information.
Cons:
- Requires significant setup and customization to fully leverage capabilities.
- Integration with existing systems can be complex and may pose challenges.
- The software necessitates time for initial setup and training.
Pricing: While Jedox doesn’t disclose prices online, an online source shares that they start at $160/user/month.
10. Anaplan
![]()
Anaplan is an enterprise-grade planning platform that enables companies to connect, model, and optimize their business processes. It’s designed for finance teams and business users to build robust models for comprehensive financial, sales, HR, and supply chain plans.
The solution includes an application platform for creating or modifying financial planning and utilizes proprietary Hyperblock technology for building what-if scenarios.

Key features:
- Provides advanced modeling capabilities for intricate business models.
- Ensures data accuracy, integrity, and accessibility with data management tools.
- Supports real-time sharing and editing of planning models with collaboration capabilities.
- Allows users to gain actionable insights from their planning data with reporting and analytics features.
Pros:
- Users can create intricate business models tailored to specific needs.
- Supports real-time sharing and editing of planning models.
Cons:
- The implementation and usage costs can be prohibitive, ranging from $30,000–$50,000 or more.
- New users may find the system complex, requiring extensive training and time to master.
- To fully leverage Anaplan's capabilities, substantial customization and setup time may be necessary.
Pricing: Anaplan doesn’t disclose specific pricing online, but does share that it offers three plans: Basic, Professiona, and Enterprise. Contact them for a custom quote.
11. Datarails
![]()
Datarails is an Excel-native FP&A platform designed for finance teams that want to keep their existing spreadsheets while adding a centralized layer for data consolidation, reporting, planning, and analysis. It connects data across Excel files and source systems such as ERP, accounting, CRM, HRIS, and banks, then structures that data inside its FinanceOS environment for reporting and planning workflows.
Datarails enables teams to keep working with their Excel financial models, create new ones, or change their assumptions.

Key features:
- Connects and consolidates data across Excel files and source systems such as ERP, accounting, CRM, HRIS, and banks into a centralized FinanceOS layer.
- Keeps Excel as the modeling interface while adding workflow controls for versioning, review, and cross-team input on budgets, forecasts, and plans.
- Automates reporting for core statements and management views, with dashboards and drill-down analysis for variances, trends, and anomalies.
- Includes FP&A-focused AI capabilities designed to generate summaries and insights tied to the underlying finance data, alongside modules for cash management and month-end close coordination.
Pros:
- Supports Excel-based workflows alongside a centralized FP&A platform.
- Consolidates reports across multiple source systems once mapping is set.
- Includes workflows for assigning inputs, collecting submissions, and review.
- Offers drill-down dashboards and widgets for variance and detail analysis.
Cons:
- Setup and data mapping can require training and hands-on guidance.
- Some features depend on plan level, which can restrict access or licenses.
Pricing: Datarails pricing is divided into professional, premium, and enterprise, which can only be gotten by requesting a quote.
12. Planful
![]()
Planful is a financial performance platform that brings financial close, consolidation, planning, and reporting into one system for finance teams. It supports FP&A workflows across functions (finance, accounting, HR, sales, operations) with a shared data model, governed reporting, and controls designed for audit and access management.
Planful also includes embedded AI capabilities, including an Analyst Assistant that answers natural-language questions with explainable outputs tied to the logic and calculations inside the platform. Alongside that, Planful AI features cover anomaly detection, baseline projections, and in-product guidance to support analysis, forecasting, and adoption.

Key features:
- Combines close, consolidation, planning, and reporting in a single financial performance platform.
- Supports natural-language Q&A through an AI Analyst Assistant with explainable outputs tied to platform calculations.
- Flags anomalies, outliers, and errors with context through AI-driven monitoring (Signals).
Pros:
- Simplifies forecasting and actuals tracking across multiple projects
- Centralizes data from multiple sources in one platform.
- Standardizes budgeting and forecasting through reusable templates.
Cons:
- Processing and refresh times can lag with large datasets or heavy template runs.
- Some teams report platform inconsistencies across modules and screens.
- Some product updates and enhancements take longer than expected.
Pricing: Pricing isn't available on its website
13. Causal
![]()
Causal is a financial planning and reporting platform that brings your financial statements, SaaS metrics, budgets, forecasts, and scenario plans into one workspace. It connects to systems such as QuickBooks and Xero, as well as HRIS, CRM, data warehouses, and spreadsheets, so actuals flow into models automatically.
Teams use Causal to build and maintain operating models with human-readable formulas, then share dashboards and reports with role-based permissions.

Key features:
- Builds models with human-readable formulas and multi-dimensional structure across products, regions, and time.
- Connects live actuals from accounting systems (QuickBooks/Xero) plus HRIS, CRM, data warehouses, and spreadsheets into a single model.
- Supports financial statements, SaaS metrics (ARR reporting), budgets, forecasts, hiring plans, and consolidation inside the same workspace.
- Enables transaction drill-down and variance analysis so teams can trace totals back to underlying entries and compare model versions against actuals.
- Includes human-readable formulas, multi-dimensional and cohort modeling, one-click scenarios, currency conversion, and granular permissions for shared reporting.
Pros:
- Maintains a clean, visual interface for dashboards and models.
- Supports complex modeling with named formulas and flexible structures.
- Connects actuals and forecasts through integrations such as QuickBooks, Xero, and Google Sheets.
- Enables sharing with stakeholders, with options to tailor views and collaborate.
Cons:
- Some users report billing and cancellation handling concerns after the Lucanet acquisition.
- New users may find the platform technical, requiring time to learn Causal’s modeling approach.
- Certain workflows may face limitations, such as missing integrations for specific SaaS tools or tier-based category caps.
Pricing: Pricing is not listed on its website.
14. Budgyt

Budgyt is a budgeting and FP&A platform built by former CFOs to replace spreadsheet-based budgeting workflows. It centralizes budget inputs across departments, keeps rollups and driver formulas structured, and supports ongoing reforecasting so finance teams can update plans without managing multiple file versions. It also includes variance analysis with drilldown detail and audit trails, which helps teams explain how numbers were built during leadership reviews and board meetings.

Key features:
- Ensures traceability with audit trails and drill-down views that show how each number was built.
- Supports department-level collaboration with permissions so contributors update assigned areas without affecting the full model.
- Automates payroll allocations across departments, grants, or cost centers using percentage-based rules.
Pros:
- Makes uploads, reporting, and drilldowns simple for both finance and non-finance users.
- Speeds setup and onboarding with guided implementation and responsive support.
- Keeps budgeting collaborative with role-based access and scenario cloning for forecasts.
- Improves manager reviews with clean dashboards and department-level income statement views.
Cons:
- Integrations can feel limited when you manage multiple entities or companies.
- Advanced modules can take extra effort to set up and maintain long term.
- Payroll and HR formulas can be tricky to adjust once scenarios are locked or cloned.
Pricing: Pricing depends on the number of departments your company has.
The top financial modeling software according to AI and Redditors
The best financial modeling software depends on your needs, with Microsoft Excel remaining the universal standard for flexibility, while specialized platforms like Anaplan, Cube, and Datarails offer enterprise control, better collaboration, and AI-driven insights, and tools like Jirav, Finmark, and Causal simplify modeling for SMBs and startups by connecting data sources and automating forecasts.
On Reddit, the sentiment is similar. One commenter calls Excel “the lingua franca of the business world,” noting its reach and client familiarity. Another adds that Excel works well for modeling, especially with add-ins, because it is “too universal” to replace in many finance workflows.
Tools like Cube help teams keep Excel and Google Sheets as the modeling surface while adding a connected planning layer behind the file. Finance can build and update models in spreadsheets, then publish interactive versions to Cube Workspace so stakeholders can review results, drill into variances, and submit inputs without editing formulas or managing multiple spreadsheet versions.
Why is financial modeling important?
Financial modeling is important because it turns financial statements and operating drivers into a decision-making tool you can test before you commit. Analysts use models to estimate company value, evaluate a project’s viability, and understand how cash, margin, and runway change when hiring shifts, pricing moves, or costs rise. PwC reports that 58% of CFOs are increasing their focus on cash and liquidity forecasting to adjust planning in a volatile environment.
Picture this: you plan three hires next quarter. A model lets you plug in start dates, compensation, and ramp time, then compare a base case with a slower-revenue scenario. You can immediately see the impact on cash balance and runway, and decide whether to hire all three now, stage hiring across two months, or adjust spend elsewhere.
Financial modeling with spreadsheets vs. financial modeling software vs. financial model builders
Financial modeling spreadsheets are usually created in Excel or Google Sheets from scratch by an FP&A professional. When relying solely on spreadsheets, FP&A teams must manually aggregate, input, and analyze the data for financial modeling. This is time-consuming and can lead to errors and miscalculations.
Financial modeling software enhances the way FP&A teams work with spreadsheets, transforming manual processes into more efficient workflows. Instead of relying solely on spreadsheets for data input, aggregation, and analysis, FP&A software like Cube integrates seamlessly with tools like Excel and Google Sheets.
This allows teams to continue using the spreadsheets they know and trust while automating data updates, ensuring accuracy, and providing advanced features like scenario modeling and real-time collaboration. Rather than replacing spreadsheets, FP&A software empowers teams to work smarter and more efficiently, combining the flexibility of spreadsheets with the scalability of modern technology.
Financial model builders go a step further by generating models for you. These tools typically ask for inputs like revenue drivers, headcount, costs, and timing, then produce a structured model using built-in logic. Many rely on templates, guided setup, or AI-assisted builders, which helps teams get a working model faster, especially when they don’t want to design one from scratch.
Get started with the best financial modeling software
Better, more accurate financial models are invaluable to every organization. Whether you're a startup navigating uncertain waters or a well-established enterprise planning for growth, the ability to forecast, analyze, and strategize with precision can make all the difference.
Fortunately, modern financial modeling software empowers teams to automate tedious tasks, integrate data seamlessly, and visualize complex scenarios with little effort.
If your team is looking for an easier, faster way to create multi-scenario forecasts, conduct sensitivity analyses, or present board-ready reports, Cube may be the solution you’re looking for.
Cube transforms raw data into actionable intelligence, unlocking new opportunities, mitigating risks, and driving sustainable growth. Want to see for yourself how Cube can help your business?
