What is a balance sheet projection?
A balance sheet projection, also called a balance sheet forecast, is a guide to a business’s financial situation in the future. The forecasts are based on the current balance sheet. A balance sheet projection looks at assets, liabilities, and equity. Then, it works out three others: cash flow, solvency, and liquidity.
A balance sheet forecast helps business owners and finance teams to make better decisions. A company’s growth plans, investments, and headcount are determined by how healthy the financials are. Without a balance sheet forecast, a business risks making unsustainable changes it can’t afford in the long term.
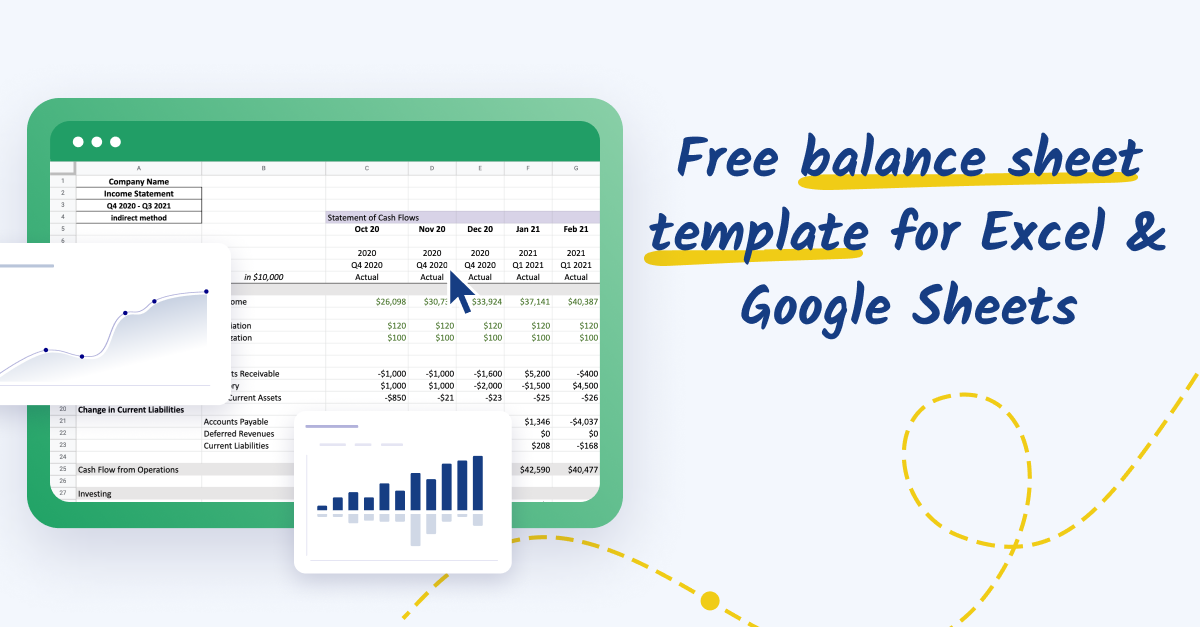
Download this free balance sheet template to get started
Why are balance sheet projections important?
A balance sheet forecast gives businesses an assessment of scaling up, managing operations, and investing in new technologies without overspending. If the fiscal year isn't going well, the balance sheet forecast gives the FP&A team a chance to correct course and put in place cutbacks to get profitability back on track.
Here’s an example: you want to increase headcount by 10% in the next year, but your projected cash flow isn’t looking too hot. Your business’ liabilities have also gone up. It might be best to put those plans on ice until the company is in a better financial position. You’ll only know this impact by completing a balance sheet forecast.
Alternate example: you had a bumpier year in sales and your balance sheet projections look healthy, but the global economic situation isn’t great. Now might be the time to put away retained earnings to weather the storm.
If you’re looking to take on new funding, balance sheet projections help communicate with potential investors. You can instill confidence in your stakeholders by demonstrating an excellent financial track record, with projections to prove it.

What should I watch out for in a balance sheet projection?
Balance sheet projections are valuable tools, but no forward projection is perfect. You’ll need to look out for any inaccuracies in the figures, potential risks in the business that could affect the financials, and how it compares to the previous year’s financial performances.
Mismatched or unreliable data
A projection is only as good as the data inputted into it. If there are flaws in the current balance sheets, or they haven’t changed in a while, your projections will not truly reflect your financials. Check your data integrity and adjust the models for your projections if it looks off.
Known future anomalies
While you can’t predict every future risk that might affect your business, you’ll know whether anything on the immediate horizon might impact your balance sheet projections. If you haven't already, you should factor any red flags into your estimations.
Recent changes that make predictions less certain
Lastly, if you haven’t greatly changed the business, you can compare your current projections to previous fiscal years. Do they seem accurate? Is there a significant loss or surplus in the estimates you can’t account for?
Looking back at records can give you a more precise picture of the future.
Best practice for balance sheet projections
If you want the most accurate forecasting for your business, then your modeling needs to be effective.These best practices will set you up for success and give your projections a good start.
Gather more than two years of historical data
Context is vital for financials. You need at least two years’ worth of historical data, like cash flow statements, to forecast a balance sheet. The more data you give it to analyze, the more accurate the reporting will be.
Reclassify GAAP to suit your needs
There’s such a thing as optimizing your data for financial forecasting. While Generally Accepted Accounting Principles (GAAP) are for financial statements, your data might be better suited to different categories for your balance sheet projections so that they’re better reflected in the forecasts.
For example, separating and reclassifying long-term debt to short-term debt if a company expects to pay it off in the next year gives a more accurate picture for forecasting.
Use supporting schedules
Sometimes, your balance sheet forecasting needs a little help. The supplemental information from supporting schedules means your projections can give more insight into the company’s future financial performance.
An example of a supporting schedule could be detailed on a business's debt. You could include information on the interest rates, repayments, and when the debt finishes so the modeling can factor this data into the projections.
How to forecast a balance sheet
Now that you know some best practices with balance sheet forecasts, how do you get started?
Forecasting the balance sheet means working out the business’s future financial position—its assets, liabilities, and equity. Each business’s incoming and outgoing finances are unique: look at any planned divestment, acquisitions, or investments on the horizon. You’ll also need to be mindful of the economic climate and any business operations that could affect your company’s financials.
A typical balance sheet forecast spans 12 months, but your forecast period can be any time you need. Below, we’ve outlined some core considerations for getting your balance sheet projections up to scratch.
Forecasting cash flow
To run a successful company, you want to know if you're running short on money or doing well. Accurate cash flow forecasts are vital for the rest of your balance sheet projections. You'll need to use income statement line items to forecast cash flow and predict what sales will look like, plus any short-term expenses you might need to cover.
Working capital
The best way to start is by forecasting the net working capital, a short-term measure of a company’s financial health. In its simplest form, you’re subtracting the current liabilities from the current assets.
Some working capital may also be sensitive to global market trends and changes to business operations. For example, if your company relies on importing goods and there’s a geopolitical issue in the region you buy from, your business’s working capital could go up or down.
Assets can include:
- Cash: Reserves in the bank
- Accounts Receivable (AR): The amount of short-term money that’s owed from customers for goods and/or services
- Inventories: Whatever materials a company uses to produce a product, plus any finished products ready to sell
- Prepaid Expenses: Expenses that have been paid in advance
- Other Current Assets: Current assets that will be either converted into cash or used up within the next year
Liabilities could look like:
- Accounts Payable (AP): The amount of short-term money owed by the business to other companies
- Accrued Expenses: Unpaid expenses for the company
- Deferred Revenue: Revenue that’s been received by a company but not realized yet
- Taxes Payable: Taxes owed but not yet paid
- Other Current Liabilities: Debts that are expected to be paid off in the next 12 months
Working capital roll-forward
The working capital roll-forward takes your net working capital and tracks how it changes over time. Essentially, a roll-forward monitors the movement of current assets and liabilities across accounting periods to give you a clear view of your short-term liquidity. It’s a shrewd tool for financial planning and analysis (FP&A) as it ensures your balance sheet projection reflects actual cash flow and working capital trends.
To find the change in working capital, start with the beginning working capital, add changes in assets, and then subtract liabilities. The formula is relatively simple:
Ending working capital = Beginning working capital + changes in current assets - changes in current liabilities
Balance sheet software will automate working capital roll-forwards to save you time and cut out errors. With reliable insights into your short-term financial health, you can prepare for loans and acquisitions or optimize your cash flow confidently.
Fixed assets: PP&E and intangible assets
Long-term fixed assets like machinery and equipment count as property, plant, and equipment (PP&E). Intangible assets concern patents, trademarks, and copyrights. The more revenue a company generates, the more PP&E and intangible assets it usually has.
These assets typically last for years, but their value needs to be forecasted yearly due to depreciation. This can make predictions tricky at times, but you can use roll-forward calculations for both to determine the change in any value.
Goodwill is a specialist intangible asset class that comes into play when companies are acquired. It reflects a company’s financial standing with customers, suppliers, investors, or stakeholders. Unless you’re on a spending spree, it rarely comes into play, but it is still good to have on your projected balance sheet.
Debts
In accounting, debt is treated differently because it accrues interest expense, whereas liabilities do not. Long-term debt projections are calculated using the opening balance as a starting point, then adding any interest and subtracting repayments.
It’s worth including some disclosure on when the debt is set to be paid off, even if a company plans on borrowing more in the future. This is because it's assumed that companies are continuously paying off and refinancing debts to maintain a healthy capital structure.
Equities and retained earnings
Once you’ve subtracted the liabilities from the assets, you’re left with the equity. This can include a few different equity types, including shareholder capital, new stock issuance, and common stock.
Stock-based compensation for employees and treasury stock, which is stock repurchased from shareholders, are treated as reductions in equity.
Retained earnings also fall under this category. This is the company’s income that isn’t distributed amongst its shareholders; instead, it's kept aside for lowering debt or reinvesting into the business. It’s a good indicator of how well a company is doing: the more retained earnings it has, the less it needs to rely on outside investment.
Other comprehensive income (OCI) is anything that can’t count as net income but still needs a place on the balance sheet. This can include items like foreign currency adjustments, or unrealized gains or losses on investments and pension plans.
Retained earnings roll-forward
A retained earnings roll-forward tracks how a company’s accumulated profits change over time. CFOs can use it to measure their financial stability and reinvestment capacity. Balance sheet software simplifies the calculation by pulling your beginning retained earnings, net income, and dividends paid from your FP&A software in real time.
Start with your retained earnings at the beginning of the period you want to study. Add net income over the period and subtract dividends paid to give you the ending retained earnings.
Cash and short-term debt
These two items go hand in hand, as short-term debt can compensate for any projected cash flow shortfall. To accurately forecast short-term debt, use the cash flow statement projections as a starting point. This will reveal any potential upcoming cash deficits or surpluses. If there’s a cash deficit, short-term debt can fill this gap.
No additional borrowing is needed if the company is projected to be flush with cash to compensate for any cash flow projection shortfall.
Other items to include in your balance sheet forecasts
A few items in your balance sheet projections may not fit into the other categories. They still need to fit somewhere in the forecasts to get an accurate sense of your company’s financial health.
Deferred taxes are the future tax consequences of events that have already been accounted for in a business’s financial statements. Tax assets could include deductions yet to be realized, typically tied to revenue projections. Tax liabilities are upcoming tax payments, which typically tie into operations.
Some items don’t have any particular category but must be included in balance sheet forecasts. These could be land holdings or leases, long-term debt, or pension liabilities.
Best balance sheet software to simplify balance sheet projections
The right balance sheet software draws up accurate balance sheet projections with almost zero effort. At the click of a button, they pull in information from a range of data points, automate calculations, and provide ongoing insights to keep your forecasts on point.
Here are some of the top balance sheet projection solutions on the market today.
1. Cube

Cube is an AI-powered, cloud-based FP&A software that simplifies balance sheet projections and financial forecasting. It integrates seamlessly with spreadsheets and accounting platforms, pulling historical data on fixed assets, working capital, cash flow, and tax information to automate accurate balance sheet calculations. Users start with premade, compliant balance sheet templates that get you started immediately without spending time building financial models. This reduces manual data entry and errors so you can make more informed decisions about your assets, liabilities, and equity.

Key features:
- Automated balance sheet projections that dynamically update based on real-time financial data
- AI Smart Forecasting that removes the need for manually building models
- AI-powered scenario planning and forecasting tools to model different financial outcomes and assess risks
- Spreadsheet-native integration with Excel and Google Sheets to easily manipulate data
- Customizable dashboards and reports tailored to your key financial metrics and planning needs
- Multi-source data consolidation to centralize financial information from accounting and enterprise resource planning (ERP) systems
- Version control and audit tracking to maintain a record of financial model changes
- Automated variance analysis to compare projected vs. actual balance sheet figures.
- Collaborative financial planning with role-based access for teams working on projections.
- Drill-down capabilities for detailed analysis of balance sheet components.
- Cloud-based access and security to ensure real-time collaboration and data protection.
Pricing: Cube scales to meet the specific needs of each client, so you only pay for the features you enjoy.
Book a free demo with the Cube team to customize a platform where you can launch balance sheet projections and much more—without the busy work.
2. Intuit QuickBooks

QuickBooks is an accounting software solution for small to mid-sized businesses with features for balance sheet projections and financial planning. It automates financial tracking and reporting while integrating with bank accounts and other financial planning apps like Cube to keep accurate records of assets, liabilities, and equity. It updates with changes in tax and accounting laws so you can create balance sheet forecasts while staying compliant with accounting standards.

Key features:
- Automated financial tracking that updates balance sheet components in real time
- Customizable balance sheet reports to analyze assets, liabilities, and retained earnings over time
- Cash flow projection tools that help estimate future liquidity and financial health
- Bank and credit card integration to track transactions that impact the balance sheet
- Multi-user access and permissions to collaborate on financial planning and reporting
Pricing: Quickbooks has a range of plans that increase in complexity and users as you grow.
- Simple Start: $35/month
- Essentials: 65%/month
- Plus: $99/month
- Advanced: $235/month
See our full comparison of NetSuite vs QuickBooks
3. Sage Intacct

Sage Intacct is a cloud-based financial management solution that supports long-term financial planning and balance sheet projections. It integrates with other accounting and ERP tools, making it easier to consolidate financial data. With built-in automation and reporting capabilities, you can use it to compare assets, liabilities, and equity over time to get roll-forward data and extrapolate it into forecasts.

Key features:
- Automated balance sheet forecasting for financial planning with reduced manual data entry
- Customizable financial dashboards to monitor assets, liabilities, and retained earnings
- Multi-entity consolidation to manage financial reporting across multiple business units or subsidiaries
- AI-powered anomaly detection to identify inconsistencies and keep balance sheet projections accurate
- Integration with accounting and ERP systems for data synchronization and financial visibility
Pricing: Sage Intacct customizes pricing based on business size, users, and feature requirements.
4. Zoho Books

Zoho Books helps businesses manage balance sheet projections and financial planning with automated bookkeeping, real-time reporting, and bank integrations. Track assets, liabilities, and equity before collecting insights and planning with financial analytics and forecasting tools. Zoho Books has a wide range of tiers so businesses of different sizes can project future financial positions and make data-driven decisions.

Key features:
- Automated balance sheet calculations to track assets, liabilities, and retained earnings in real time
- Custom financial reports and dashboards to analyze balance sheet trends and forecast future financial performance
- Cash flow forecasting tools to project liquidity and assess financial stability over time
- Bank reconciliation and transaction tracking to ensure accuracy in balance sheet reporting
- Multi-user collaboration with role-based access for secure financial data management
Pricing: Zoho Books offers tiered pricing plans, including:
- Free:$0/month
- Standard: $12/month
- Professional: $24/month
- Premium: $30/month
- Elite: $99/month
- Ultimate: $199/month
5. FreshBooks
.png?width=239&height=70&name=freshbooks-logo-1%20(1).png)
FreshBooks is aimed at small businesses and freelancers who want to simplify their financial management. Automated expense tracking, invoicing, and reporting gather an accurate record of assets, liabilities, and equity. Forecasting tools allow you to create reliable balance sheet projections to plan for growth and manage cash flow.

Key features:
- Automated financial tracking that updates balance sheet components in real time
- Customizable balance sheet reports to analyze financial performance and project future trends
- Cash flow forecasting tools to estimate liquidity and financial health over time
- Bank reconciliation and transaction tracking for accurate financial reporting
- Multi-user collaboration with role-based permissions to ensure secure financial data management
Pricing: FreshBooks offers pricing packages for freelancers, self-employed users, and businesses with contractors. Businesses with employees need to reach out for a customized package.
- Lite: $19/month
- Plus: $33/month
- Premium: $60/month
6. Xero
.png?width=218&height=109&name=xero-logo%20(1).png)
Xero is an accounting and bookkeeping platform that allows you to manage balance sheet projections with real-time financial tracking and automation. It integrates with major banks, ERP systems, and financial planning apps to glean diverse data points. Automated record-keeping and customizable reporting tools provide insights into assets, liabilities, and equity.

Key features:
- Integration with forecasting apps that utilize budget numbers or recent actuals from Xero to create draft balance sheet forecasts
- Scenario planning tools to model different growth rates and assess their impact on the balance sheet
- Automatic tax calculations within forecasts ensure compliance and accuracy
- Cash flow visualization draws on historical data and invoice payment patterns
- User-friendly, graphical reports make complex financial data easy to understand
Pricing: Xero offers three different pricing tiers:
- Early: $20/month
- Growing: $47/month
- Established: $80/month
Steps for balancing your model
Now that you’ve sorted the projections, you need to make sure everything matches up, also known as balancing the model. Balance sheet forecasting fundamentals involve assets, liabilities, and equities. If everything is worked out correctly, the liabilities subtracted from the assets should add up to the remaining equity in the company.
But as you’ll now know, it’s never that straightforward. This can lead to the model needing rebalancing to account for any errors. Thankfully, careful editing can address any anomalies and bring your balance sheet back into harmony.
- Check over the completed balance sheet line items. See how they compare to previous financial years and anything in the pipeline. Does it match up? If not, revisit your figures.
- Correct any errors. You may need to crunch the numbers again, remove any anomalies, or rein in any assumptions in the projections.
- Re-run the newly updated numbers to get your new projections. Check them against the benchmarked data again.
- Check your cash flow statement and forecast if it still doesn’t match up. This is often the culprit of any errors. For example, if you haven’t accounted for the cash impact of assets affecting revenue growth, this can throw your figures.
Once you’ve balanced the balance sheet forecast, you can continually update the model if the company’s financial situation changes. This way, you’ll stay on top of your financial projections and be able to make informed business decisions.
Download this free balance sheet template to get started
Balance sheet forecast example
Let’s run through a very simple example of what a forecasted balance sheet looks like.
| |
Current year
|
Next year
|
|
Assets
|
|
|
|
Cash
|
$100,000
|
$120,000
|
|
Accounts receivable
|
$50,000
|
$60,000
|
|
Inventory
|
$20,000
|
$25,000
|
|
Intangible assets
|
$30,000
|
$40,000
|
|
TOTAL
|
$200,000
|
$245,000
|
|
Liabilities
|
|
|
|
Accounts payable
|
$35,000
|
$50,000
|
|
Long-term debt
|
$15,000
|
$25,000
|
|
TOTAL
|
$50,000
|
$75,000
|
|
Equity
|
|
|
|
Shareholder capital
|
$100,000
|
$110,000
|
|
Retained earnings
|
$50,000
|
$60,000
|
|
TOTAL
|
$150,000
|
$170,000
|
Each time, the equity is the number of liabilities minus the assets. Your financial model will have more complex needs, but this example shows the core principles of balance sheet projections.
If your figures aren’t adding up, check the next section for tips on fixing your forecasts.
Streamline balance sheet forecasting and projections
Now you know how to create a balance sheet projection. You also learned why balance sheet forecasting is vital and how it can help you create more accurate financial models.
If you're like the 92% of FP&A teams that use Excel, then you should check out Cube. Cube handles all the manual labor of organizing, checking, and cleansing your source system data. Plus, it makes it easy to pull it into Excel.
Request a demo to learn more.


.png)