What are FP&A Excel templates?
FP&A Excel templates are prebuilt spreadsheets finance teams can use to speed up the financial planning and analysis (FP&A) process. These templates come with relevant formulas, visualizations, and formatting for managing, analyzing, and forecasting financial data.
Common FP&A Excel templates include budgeting templates, P&L templates, 3-statement model templates, and rolling forecast templates.
Why take advantage of FP&A Excel templates?
- Templates have preformatted elements such as fields, cells, headers, and formulas, which helps finance teams save time when doing repetitive tasks like creating reports and business budgets, building financial forecasts, and tracking inventory.
- Predefined formulas and other elements help standardize the way users input information, reducing errors during analysis.
- Templates ensure that all spreadsheets and finance dashboards have the same look, feel, and structure, supporting easy sharing and collaboration.
- A consistent structure makes it easier to compare data across multiple documents (e.g., comparing Q1 and Q3 to find variances).
How to use FP&A Excel templates

Here’s a step-by-step process on how to use FP&A Excel templates:
-
Download and import the template into Excel or Google Sheets: Download the FP&A template from a trusted source, such as Cube’s Spreadsheet Template Library, and open it in Excel (or another preferred spreadsheet software).
-
Review the template structure: Familiarize yourself with the template layout, including the sections for input, calculations, and outputs. Modify the structure as needed by:
-
Changing values, labels, or headings to fit your business
-
Adding new formulas, calculations, or data fields relevant to your operations
-
Adjusting the formatting to match your preferences or company branding
-
Replace the placeholder data with your business data: Update the template by replacing the pre-filled sample data with your business's financial or operational data.
-
Save the modified template and update it regularly: Save the modified template as a master file for ongoing use. Regularly update it with fresh data, such as monthly financials, forecasts, or key metrics.
Once your FP&A template is set up, you’ll have a structured framework to organize and analyze your financial data. You can customize it to fit your specific needs, whether that’s tracking budgets, forecasting trends, or preparing reports to share with stakeholders.
Free FP&A Excel templates for finance teams
Speed up your financial processes with these free, customizable templates. (Bonus: These FP&A templates also work in Google Sheets if that's your team’s preferred FP&A software!)
Headcount planning template for optimal workforce planning

The headcount planning template is a structured spreadsheet that enables FP&A teams to combine HR data, financial forecasts, and operational metrics to track and forecast staffing needs and costs.
It includes sections for employee data, salary information, budget projections, and departmental allocations. To use the headcount planning template, gather all relevant employee information and input the data in designated sections. Then, use the template's forecasting and budgeting capabilities to model different scenarios.
Download the headcount planning template here.
Operating expense planning template

The operating expense planning template allows you to plan and monitor each department’s operating expenses and budget.
You can use it to compare expenditures, such as direct selling costs, with revenue and other sources of business income to determine whether the company is operating effectively and generating enough to cover short—or long-term—costs.
With this template, you can easily collect data from department leaders, get an accurate, timely view of what resources each department needs to achieve business goals, and budget accordingly.
Download the operating expense planning template here.
3-statement model template

The 3-statement model template simplifies financial reporting and forecasting by combining income statements, balance sheets, and cash flow statements into one consolidated forecast to track revenue, expenses, assets, liabilities, and liquidity.
Input financial data in preformatted sections of this template and use built-in formulas to automatically calculate key metrics such as depreciation, retained earnings, and financing activities.
You can link all three financial statements to ensure that changes in one statement dynamically reflect in the others and build adjustable projections to answer key questions about business performance.
Download the 3-statement model template here.
Financial KPIs dashboard template

The financial KPIs dashboard template enables FP&A teams to monitor the organization’s key performance indicators and measure bottom-line margins such as quick ratio, customer acquisition costs (CAC), and days sales outstanding (DSO).
This template’s financial modeling components include revenue, financial metrics, OpEX analysis, and drivers. You can build scenarios using assumptions and key drivers to get insights on how to improve numbers. It also includes advanced visualizations tied to data tables at the bottom of each page that you can review and edit or remove.
Download the financial KPIs dashboard template here.
Sales quota capacity template

The sales quota capacity template allows you to create and calculate quota plans based on your sales representatives, using data such as average deal size, attrition rate, and sales targets.
Tweak the capacity plan or build multiple plans to reflect new scenarios like hiring or letting go of a sales rep. This allows the business to stay on track to plan regardless of changing internal conditions. You can regularly track goal progress based on your data inputs and assumptions through the quota performance tab in the template.
Download the sales quota capacity template here.
Rolling forecast template

FP&A teams use the rolling forecast template to maintain a continuously updated 12-month forecast for the organization’s operating expenses (OpEx). These templates help finance teams analyze key components such as department-level and OpEx variances, planned vs. actual spending, headcount costs, sales and marketing expenses, and key business drivers. By incorporating real-time data, rolling forecasts provide a more flexible and accurate view of financial performance, enabling proactive decision-making.
To use this template, you’ll need to download the monthly actuals from your ERP system and input the data into the actualized periods.
The template enables you to plan and predict future performance based on actual performance. You can calculate your forecast figures using the “latest closed month” filter to update the time period you’re planning for.
Download the rolling forecast template here.
Cash flow statement template

The cash flow statement template is great for organizations that want to revise or refresh their cash flow reporting and operations. It's a simple template with four components: indirect cash flow, detailed cash flow, P&L (supporting information), and balance sheet (supporting information).
Input your financial statements—i.e., your P&L and balance sheets—into this template, then calculate your cash flow on a by-month basis and easily build reports. You can improve the capabilities of this template when you pair it with pro forma templates.
Download the statement of cash flow template.
P.S. Create your P&L statement with this template and create your balance sheet here.
Capital expenditures (CapEx) template

The CapEx template helps track capital expenditures and analyze past investment outcomes to make more informed capital allocation decisions.
It has three model components: CapEx-Simple, summary, and drivers for users to input spend lines for various capital expenditures and view capital spending by category or department.
The template is intuitive—after you enter all relevant data, it will calculate the associated depreciation and spend for a capital budget or forecast, and you can build reports on capital expenses.
Download the CapEx template here.
Budget vs. actual (P&L statements) template

The budget vs. actual template is a plug-and-play spreadsheet that lets finance teams monitor projected budgets, analyze profitability, and control spending. You can use this template to compare budget estimates with actual business income and expenses, allowing you to answer questions like “Did the organization meet its gross profit target for the month?” or “What are the key drivers of net income variance for a particular period?”
The template is great for month-end or period closes, when finance teams want to review performance results and assess the business’s health.
Download the budget vs. actual template here.
SaaS revenue model template

The SaaS revenue model template is ideal for subscription-based businesses, particularly SaaS companies, that need to model revenue for scenario planning, fundraising, and go-to-market strategy.
The template incorporates annual recurring revenue (ARR) and includes a detailed ARR table that breaks growth into key components: churn, contraction, expansion, and new ARR.
For accurate modeling, consider factors such as variable costs (e.g., customer acquisition costs), seasonal trends, customer segmentation, and realistic churn rate estimates.
Download the SaaS revenue model template here.
ARR forecast (revenue/churn) template
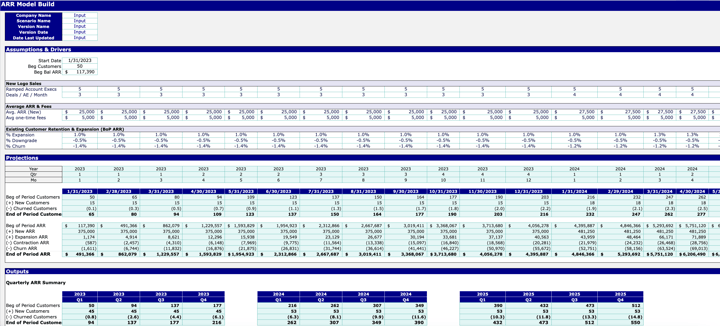
The ARR forecast template is designed for companies with subscription pricing models that need to build sales forecasts. It helps businesses assess customer base health and monitor OpEx costs.
This template uses key inputs—such as the current annual subscription amount, a list of existing customers, customer terms, and overall customer health—to generate an ARR forecast.
The model provides a simple recurring revenue projection while also calculating the likelihood of expansion, contraction, and churn for each customer. It features a color-coded system (green, yellow, and red) to indicate account status, allowing for quick insights
Download the ARR forecast template here.
Bonus templates
Build visually compelling financial calendars and quarterly board decks with these free bonus FP&A templates.
Financial planning calendar template

The all-in-one financial planning calendar template provides finance professionals with a structured way to track financial goals, strategies, and responsibilities throughout the year. It helps them stay organized and avoid costly oversights.
This template includes 15+ slides designed for effective financial planning, such as:
- A financial planning timeline for your business
- A multi-phase financial planning calendar template
- Annual and monthly budget templates
- A checklist for building an effective financial planning calendar
To create a comprehensive financial plan, collaborate with other departments to align on goals, projects, and company-wide strategic initiatives.
Download the financial planning calendar template here.
Quarterly board deck template

The quarterly board deck template is ideal for CFOs and CEOs who want to highlight strategic goals and KPIs while presenting financial information to the board in a clear, compelling, and concise manner.
This template includes 40+ slides covering:
- Company initiatives and status updates
- Core key performance indicators (KPIs)
- Department updates (with examples for sales, marketing, and HR)
- Financial summary information
- Appendix/databook examples
When preparing quarterly board reports, use data visualizations strategically—such as trend graphs for financial performance, bar charts for department comparisons, and scoring systems for risk assessments—to highlight key insights and make the data more digestible.
Download the quarterly board deck template here.
Work faster with these free FP&A Excel templates
Pre-built FP&A templates help streamline processes, improve accuracy, and free up time for high-impact financial analysis. While these templates provide a strong foundation, you can customize them to align with your organization’s specific financial needs.
Need ready-to-use templates for budget vs. actuals, cash flow, sales quotas, headcount planning, rolling forecasts, and more?
Check out Cube's full template library for tools to help you optimize your FP&A.


.png)


.png)
![What is headcount forecasting? [Free headcount forecasting Excel template]](https://www.cubesoftware.com/hubfs/Headcount%20Forecasting%20%281%29-1.png)