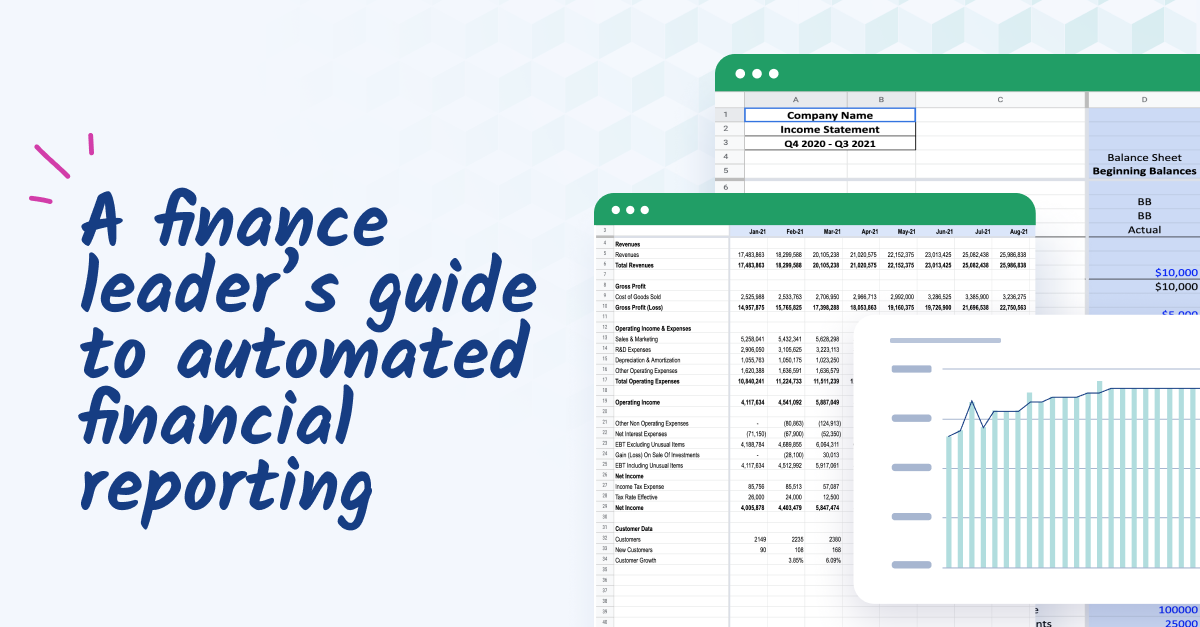
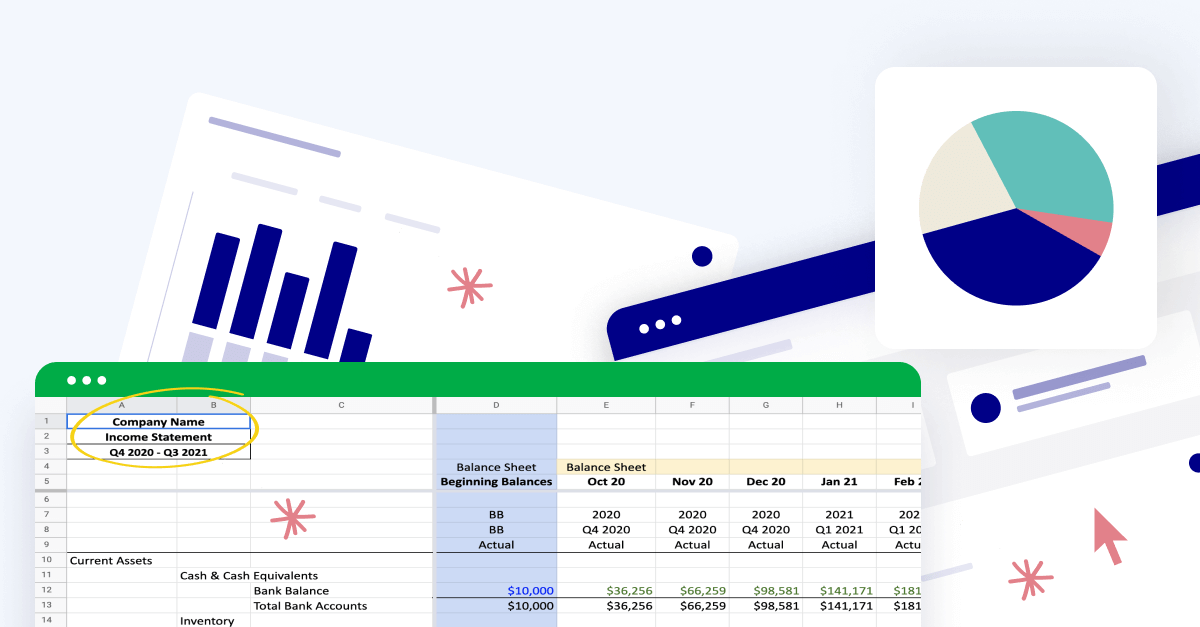
What is report automation?
Report automation takes the manual and tedious process of compiling accounting reports and uses software to process the work automatically.
Using digital data streams from other tools such as marketing automation platforms, accounting software, payroll programs, etc.,
The report automation platform pulls together the relevant data and creates visualizations and dashboards. Report automation can be used to speed up most accounting reports, including:

The complexity of financial reporting only grows as the organization scales.
For this reason, report automation quickly goes from “nice to have” to a requirement. It also frees up your teams to handle more strategic work automation can’t handle.
Benefits of report automation
Reduces errors: Manual entry errors are a common pitfall of traditional accounting methods. One study cited the invoice exception rate for manual entry at over 25%.
These exceptions impact every aspect of the accounting and reporting process. Automating reports drastically reduces exceptions, resulting in cleaner, more trustworthy data.
Increases data visibility: Manually entered financial data often lives in silos. When that data is centralized into a cloud-based FP&A platform, everyone can access the appropriate data and detail for their role.
This improves data analysis and decision-making by keeping everyone on the same page with the freshest, most accurate data.
Boosts productivity: Removing manual labor from the workday allows your teams to focus on higher-level tasks.
Everyone gets more accomplished, and their work positively impacts the business and its goals.
Saves time and money: With fewer errors, better visibility, and more productivity, reporting automation results in time and cash savings for organizations implementing it.
Reporting automation often provides a financial net positive result thanks to better performance, clearer decision-making, and reduced organizational risk.
Speeds month-end close: With report automation, all data streams flow into a centralized database to make month-end reporting and reconciliation a breeze.
How businesses create automated reports
For non-technical or non-finance teams, plenty of options exist for managing and automating the financial reporting process.
From simple templates to integrated services, the opportunity to improve your reporting through automation is easily within reach.
Standard report automation software for non-finance teams
Here are five cloud-based, accessible reporting tools that help non-finance and non-technical users capture the power of their data in automated reporting:
Microsoft Excel
While Excel is a powerful tool for accounting and reporting in its own right, the power of spreadsheets can be enhanced by pairing it with code-based query and automation tools (more on this below).
While this method significantly enhances the data capabilities of Excel, it requires a significant amount of technical knowledge.
Google Data Studio
Google Data Studio is a free, managed web service that allows users to connect one or more data streams and build an automated reporting system.
The tool creates dashboards and visualizations. It’s capable of drawing on multiple information sources and customized reporting for tech-savvy users.
Google Analytics
This free web analytics service is offered by Google tracks and reports website traffic, paid ad spend, and more.
It helps you understand website behavior and ad performance through detailed reports.
The ad spend reporting informs Finance decisions about the marketing budget.
Tableau
Tableau is a data visualization and analysis software that enables users to create visualizations of their data, analyze it, and share that insight across teams.
It's a business intelligence tool that offers other functionality, including customer segmentation, sales analysis, predictive analytics, and more.
Power BI
This is Microsoft’s cloud-based business intelligence (BI) suite.
It enables users to visualize and analyze information and trends using various data sources, including Excel spreadsheets, relational databases, on-premises data sources, and web apps.
BI’s visualization enables decision-making using all the data resources within the company.
Dashboards vs. report automation
Both dashboards and reports provide valuable business intelligence insights that can drive better decisions.
But Dashboards aren’t the same tool as a fully automated report; the mileage you get out of even a well-crafted dashboard may not be enough for all business purposes.
When to use a dashboard
Dashboards are excellent for measuring your team's performance metrics or key performance indicators (KPIs).
They provide visual data for known points or metrics requiring regular monitoring.
Dashboards can be customized to show either high-level or in-depth data, making them great for communicating financial performance and details across a wide audience.
When to use reporting
Automated and customized reporting is valuable for giving context to your real-time numbers, as reports can pull in current and historical data.
Reporting is more appropriate in cases where you’re attempting to discover data, trends, or other information not readily apparent as expected in a dashboard.
4 ways to do report automation in Excel
While we're big fans of automated reporting software, it turns out that you can already do a lot of the heavy lifting in your favorite environment.
Let's look at how.
1. Automated reporting in Excel with macros
Using Excel to automate reporting requires a functional knowledge of Microsoft’s Visual Basic for Applications (VBA) text editor. This program can automate data entry, formatting, calculations, and other repetitive processes.
To create the macro program, open the Visual Basic Editor window in Excel. You can then write the code and save it as a macro.
Once saved, you can assign this macro to a button or keyboard shortcut and use it to automate any report-related tasks you need to do.
2. Report automation in Excel with SQL
To perform report automation in Excel using SQL, you need to understand the SQL database programming language and be familiar with the query editor in Microsoft Excel.
You’ll have to connect Excel to an external SQL database.
You can write a SQL query within the editor to generate a desired Excel report. The query can be saved. This allows you to run it anytime to generate an up-to-date report version.
Additionally, Excel allows you to filter and sort the data generated by your query to customize the results of your report further.
3. Automated reporting with Python
Python is another programming language you can use with Excel to create automated reports.
Python is a general-use programming language and thus gives you access to a wider variety of abilities and commands than simple macros within the Excel framework.
Python allows you to move, manipulate, and send data to external recipients.
4. Automated reporting with Cube
Cube is a cloud-based, Excel-native financial planning and analysis (FP&A) software tool that allows organizations of all sizes to automate their reporting, create multi-scenario analyses, and automatically consolidate data.
Cube offers a range of capabilities and integrations that exceed the capabilities of even more advanced automation tools like Python.

The top 10+ automated reporting tools for CFOs and FP&A teams
Fast-growing companies and enterprises benefit from software solutions that collect, organize, analyze, and visualize their data.
This may come from accounting software, financial close platforms, performance management tools, or ERP solutions.
Here are 10 great options to consider when searching for a reporting automation solution.
1. Cube

Cube is the first Excel-native, cloud-based FP&A software platform that helps finance teams work anywhere with the ultimate speed and confidence. Data analytics and generating reports become a breeze in Cube because its single source of truth ensures that your data is always correct.
And since Cube integrates with Excel and Google Sheets, you can give management access to real-time reporting via the cloud. It's that good.
This is on top of Cube's strong automated data consolidation, in-depth and automated analysis, and performance management capabilities.
Features
- Excel integration with no need for plug-ins or extensions.
- Multi-currency support for international business needs
- Audit trail support for drilling down into transactions and cell discrepancies.
Pros
- Fully Excel-native experience pairing the power of spreadsheets with the flexibility of a cloud-based FP&A platform.
- Easy to use and intuitive access to the right data for power users and casual users alike.
- Ease of use, including data fetching and publication.
Cons
Pricing
Prices start at $1,350 per user per month. See detailed pricing.

2. QuickBooks

QuickBooks is a familiar and versatile small business accounting software with useful reporting features and integrations to keep finance on track. Manage every aspect of your small business from within the platform.
Features
- Easy to use, intuitive interface great for all types of users.
- Some reporting features including financial statements, P&L, and tax reports.
Pros
- User-friendly for casual or first-time accounting software users.
- Unlimited billable clients at an affordable price.
- Brings all your accounting and financials into one place.
Cons
- Customization and automation are lacking
- Limited user count geared toward small and medium businesses.
- Doesn’t integrate well with Excel.
Pricing
Plans range from $7.50 to $100 per user per month during a 50% trial period before moving to full pricing of $15 to $200 per user per month. Enterprise plans range from $1,700 to $4,200 per user annually.
3. BlackLine
.png?width=150&height=44&name=BlackLine_Logo%20(1).png)
BlackLine is financial close software that provides automation and financial reporting features to help businesses of all sizes close faster and more accurately.
Features
- Smart Close for SAP
- Dynamic user management features
- Reporting and variance analysis
- Integrations with other vital services
Pros
- Advanced capabilities for Journal Entries, and reconciliations automated processes.
- Internal and external audit support and cost reduction.
- Cloud-based product with plenty of integrations.
Cons
- Several users report lag in the system and issues with data freshness.
- Some UI features aren’t intuitive and can confuse users.
Pricing
Blackline does not provide pricing information on its website.
4. Acumatica

Acumatica is a cloud enterprise resource planning (ERP) tool with built-in accounting and financial planning features.
Features
- What-if scenario analysis for financial planning and forecasting
- Strong visualizations for all the data streams across your organization.
- On-premise, virtual server, or cloud-based implementation options.
Pros
- Built-in CRM that integrates sales and operations into the financial planning process.
- Easy interface and adoption process good for first-time ERP users.
- Strong integrations to centralize all data streams into a central source of truth.
Cons
- User-based permission administration can be cumbersome.
- Bank matching is sometimes difficult to achieve or adjust.
Pricing
Custom pricing based on individual feature choices and user seats.
5. FreshBooks
.png?width=150&height=44&name=freshbooks-logo-1%20(1).png)
FreshBooks is a cloud-based accounting system built for small and service-based businesses.
It offers straightforward features and pricing for freelancers and others looking for a basic solution that integrates with other tools (like Quickbooks).
Features
- Invoice creation and ACH payment processing.
- Accounting, AR, and AP integrations.
- Easy-to-understand activities dashboard for tracking work and payments.
Pros
- Strong invoicing and payment processing capabilities that make it easier for small businesses to issue invoices and get paid quickly.
- Simple interface perfect for first-time accounting software users.
Cons
- FreshBooks is designed with the small business person in mind. It’s not intended for medium or enterprise businesses.
- Limited users on lower-tiered plans require upgrades as your business grows.
Pricing
Pricing starts at $15 per month.

6. Mosaic Tech
.png?width=100&height=100&name=mosaic.tech-logo%20(1).png)
MosaicTech is an analytics and planning tool for strategic financial planning, focusing on planning and reporting capabilities for SaaS clients.
Features
- Strong visual reporting capabilities
- Budget and planning features and visibility
- Customizable, cross-departmental reporting.
Pros
- Good version control to ensure the freshest data and reduce data issues or redundancy.
- Budgeting formulas to help Finance leaders makes sound financial decisions.
Cons
- The implementation period may take months, contrary to promises.
- There are better choices for non-SaaS entities looking for an automated reporting solution.
- Has a steep learning curve with a long onboarding period.
Pricing
Mosaic does not provide public pricing information.
7. FloQast
.png?width=150&height=86&name=floqast-logo%20(1).png)
FloQast is financial closing software for mid-market companies with plenty of features and integrations.
Features
- Data consolidation
- Financial report creation and distribution
- Journal entry adjustments
- Audit trail features
Pros
- Clean interface
- Helpful customer support
- Flux and variance analysis
Cons
- Syncing issues
- Role-based administration challenges
Pricing
$1300+ per user, billed annually, including additional features.
8. SAP Business One

SAP Business One is an ERP system for small businesses that offers CRM, inventory management, business operations management, and reporting features.
Features
- Financial planning and analysis (FP&A) features
- Financail close and AP/AR management
- Treasury management
Pros
- Offers a full complement of management services for supply chain, product lifecycle, human capital, employee experience, and other types of management.
- Strong customer service and support teams to address challenges
Cons
- Reporting can be rigid, and visual customization features aren’t strong.
- Difficult implementation requires external teams for smaller business entities.
Pricing
Pricing for SAP Business One starts at $3,200 per named user, with additional maintenance fees due every year. A professional license subscription costs over $100/month with no extra fees.
9. NetSuite

NetSuite is an enterprise-class, cloud-based finance software within a larger product suite, including ERP, accounting, CRM, and HRM modules.
Features
- Provides a one-stop solution for large organizations searching for a financial tool suite.
- Integrates with Cube to provide a single source of truth within a single experience.
Pros
- Customization for well-tailored, targeted reporting needs.
- Multi-currency support for international entities
Cons
- May need in-house accounting or financial support for implementation.
- Manual entry is still required for data completeness.
- Users report challenges with pulling financial data from the platform.
Pricing
NetSuite doesn't publish pricing but is reportedly more expensive than other options.
10. Sage Intacct

Sage Intacct is an enterprise-sized financial management software with strong account reconciliation capabilities for comparing and analyzing many data streams.
Features
- Automated account reconciliation features
- Workflow customization
- Strong reporting capabilities
Pros
- Built-in financial dashboards for real-time account updates.
- Strong report customization capabilities
- Intuitive design and resources make onboarding easier
Cons
- Price. Sage Intacct is meant for enterprise companies, and the pricing model reflects this.
- Errors are common and cumbersome to remedy.
Pricing
Some sources report the investment in Sage to be $15,000 to $35,000, depending on service tier and user seats.
11. Anaplan
.png?width=150&height=33&name=Anaplan_logo%20(1).png)
Anaplan is a planning performance management tool for finance and FP&A teams for enterprises. It has robust features, but it’s geared toward the enterprise crowd.
Features
- In memory processing
- Scenario planning features
- Compensation modeling
Pros
- A strong option for larger organizations with complex needs and an IT team to support the platform.
- Many customization and integration options are available to extend the platform's value.
Cons
- Implementation is complex and can take months or even years.
- A large portion of users dislikes the experience of reporting with Anaplan.
- Anaplan isn't Excel-native but instead relies on a Windows-only plug-in to connect.
Pricing
Anaplan does not publish pricing but is reportedly a very expensive option.
Conclusion: the best report automation tools
That’s everything you need to know about reporting automation and all the tools available to help you get started on your automation journey.
Want to get started with the most intuitive, Excel-native platform available on the market? Check out a demo with Cube to learn more.
Cube integrates with your source systems and cleanses, de-duplicates, and checks your data. So you're always using the most accurate, up-to-date numbers in Excel.
And Cube does more than just automate reports for financial data. Need automated marketing reports that show how contacts in your CRM became dollars? That's possible with Cube.
Click the banner below to schedule a free demo and learn why Cube is the only automated reporting software you'll ever need.



.png)




.png?width=100&height=100&name=mosaic.tech-logo%20(1).png)
.png?width=150&height=86&name=floqast-logo%20(1).png)


